 Reineck & Reineck Design
and the possibility to make better use of Economy of Scales
|
|
Disclaimer: All links functioned at conception of this e-paper; the writer does not accept responsibility for inaccurate figures due to updated versions or links no longer available.
Is Muni doing a good job? If you are from Phoenix, San Francisco's Muni cannot be anything other than wonderful. Tourists will hardly ever notice there is anything wrong with this city's public transportation. Yet the users who experience Muni on a daily basis tell a different story. Unfortunately, the negative experiences do not reverberate long at Muni's management level. When the San Francisco Civil grand jury 'ripped' Muni — in a report published July 2, 2004 — for failing to meet performance standards, and for overall weak management, the reaction wasn't one of culpability, but of surprise about the harshness of the grand jury. While the horrible years of the broken Muni system are well behind us — years that make Muni's current state seem indeed wonderful — Muni still received a poor rating. Is the harsh ruling correct? Unlike Phoenix, San Francisco is a world class city, so one should be able to measure its transit to rather high standards. When comparing Muni to information of similar transit organizations in other world cities, there seems to be some truth to the low rating.
Let's be frank about it: Muni is doing an incredible job day in day out. But there are some things that remain to be desired. By addressing the question whether Muni is making good use of the Market Street tunnel in an economically sensible way or not, this paper tries to shed some light on Muni's overall performance and management. This segment is highlighted on purpose because it makes Muni definitively stand out in the world of transit organizations. How come Muni does not make better use of scale of economy with specialized and faster transit while it can do so without investing one penny? What is a very fast specialized mode in other cities — a metro — seems to be slow and hampered in San Francisco. While it is true that there is almost nothing more expensive than to build a subway — digging a tunnel is very expensive — once a tunnel is dug there is nothing cheaper to operate in public transportation than a subway. According to Vukan Vuchic such fully grade-separated systems are three to five times cheaper to operate per passenger than a streetcar system. This is possible through scale economies in which larger scale operations bring down the price per passenger. Muni is in the possession of a completely finished tunnel, already created to be a subway, with adjusted stations to receive full length trains, but which is used to operate a streetcar system in it; this makes it slower in performance and is more expensive. The writer of this paper, Fredrick Schermer, believes that Muni can perform better. He points out that in the United States there is no free market mechanism available anymore in public transportation (but privatization waves in Europe have been going on for more than ten years), and the only way to discover at what level Muni is performing is to compare it to similar transit organizations in the industry. The results of such comparison are unfortunately obvious: Muni underperforms. It should be possible for Muni to deliver more service to its current clients and attract more clients when it decides to make use of scale of economies to operate better/more efficiently without any extra costs. Top
At one point in time, San Francisco was a Mecca for public transportation developments. One of San Francisco's best known attractions — the cable car — was designed specifically to combine the benefits of the horse car and the train and eliminate their disadvantages. Though very reliable, a train is not able to make swift stops in a city, while a horse car relied on animals that could get sick all at the same time. The cable car did not have either problem; it was able to hang onto a continuously operated cable in the ground and move up those hills without a problem. To stop quickly, the driver just let go of the cable and a step on the brakes secured the car in place. Today it still functions to deliver passengers around town, and is a magnet for tourists. The cable car shows how innovative the transit industry in San Francisco once was.
Another historical step — more of importance for today's situation — is the streetcar. The streetcar made public transportation an important and at times even indispensable part of the modern city. In 1900, many American cities had various streetcar companies competing for public with tracks in street after street. The streetcar contributed significantly to San Francisco's western expansion when the streetcar tunnel was dug underneath Twin Peaks. The Municipal Railway, a city-owned streetcar system that had started operating in 1912 on Geary Street opened that first tunnel in 1918. Real estate developers saw a gold mine in the West-Portal area and beyond. They had encouraged politicians to extend fast Muni service to these districts by means of tunnels. Tract homes were planted, not for blue collar people, but for the well-to-do, who took advantage of the transit marvel that could carry them to the downtown area fast. Muni planned three lines to go through the Twin Peaks Tunnel: the K-Ingleside, the L-Taraval, and the M-Ocean View. These lines were all operating full length by 1925. Today, this Twin Peaks tunnel still serves the three streetcar lines.
Another tunnel serves the N line to the Sunset through the same hills slightly to the North, built three years later. By that time major competition between the various streetcar companies was gulped up by the Municipal Railway. However, the next two developments to influence public transportation in a negative way were about to arrive. When General Motors fronted National City Lines in 1936 a company was erected that was able to buy up many streetcar system throughout the United States in the 40's and 50's, replacing the streetcars with bus lines; even when buses were less desired by the public. The second development to affect the streetcar negatively was that of the ever more popular privately owned cars. High maintenance costs of the streetcar systems — right after World War II with years of forced neglect — put many streetcar companies out of business. Only the strongest streetcar companies were able to survive, but even they had to trim down their services significantly. Despite the tremendous forces working against Municipal Railway, the system in San Francisco was able to hold on to some of its streetcar lines. The tunnels under Twin Peaks deliver a good explanation why in particular these streetcar lines were able to hold on. No profitable or safe bus line could be operated through the tunnels without widening them. Crossing the hills by bus was difficult while popular demand kept the tunnels open for streetcars. The cost per mile per passenger was far lower for these streetcar lines than any bus line could achieve, and thus their survival was based on economics. It made sense for the predecessor of Muni to hold on to these lines. Even today a passenger living close to West-Portal may reach town by streetcar faster through these tunnels than a person driving a car (not to mention the difficulties in finding a parking space downtown). The bus lines were never particularly liked. With most streetcar lines taken out of service, and more and more people driving their own car, a historic bottleneck in public transportation is clearly visible nation wide from the 40's on when the extinction of many a streetcar line occurred.
Like in San Francisco, other streetcar lines survived. Places with a remnant of streetcars are Boston, Philadelphia, Cleveland, Pittsburgh, Newark, New Orleans, and (the truly matured rail systems of) Chicago and New York. Here too, the underground (or elevated cars) had been put in place before the arrival of mass car ownership and the often blamed National City Lines. According to Boris Pushkarev "the physical characteristic that most surviving systems had in common was that significant portions of their mileage were on reserved or on fully grade-separated rights of way." They had such strong characteristics in performance and cost that they survived the onslaught. Their privileged specialization made them survive — it had made them indispensable. An interesting remark can be made on the specifics of the subway systems of larger and 'smaller' cities. New York and Chicago had evolved already into owning a mature transportation system — with subways and "El's" in fully controlled environments — while smaller cities like Boston, Philadelphia and San Francisco had 'only' developed up to the level where streetcars still had to compete with other surface traffic most of the time. In these cities the underground never really became true subways, though — as mentioned — their survival actually occurred due to some underground sections as part of their streetcar system. Boston and Philadelphia had fully functional tunnels but only to circumvent their busy downtown areas. In these two East Coast cities several streetcar lines would go underground — sharing the tunnel — where at the downtown end circular tracks would help the cars turn around smoothly into the other direction. What went in, came out just as fast.
The undergrounds and elevations of New York and Chicago had evolved from streetcars to subways — with only a few long lines that had stops far in between, long stations to accommodate long trains, and with many passengers getting in and out in a short period of time. Large amounts of people moving in the same direction made such larger scale possible. The previous situation of many competing streetcar lines had now become a set of only a few super lines built underground. This is a development that had not taken place fully in San Francisco, Boston, or Philadelphia. In time, these cities might have developed subway lines if certain developments, like the arrival of the private car, had not happened. The results of this divergence in progress between the larger and the smaller cities were quite dramatic. According to Pushkarev, the ridership dropped only 5% from 1955 to 1969 for the 'superior' lines, while the ridership for surface lines — streetcars and buses — sustained as much as a 40% loss. The conclusion seems justified that systems making use of larger scale of economies hardly got impacted during the bottleneck years.
Despite the positive examples, it is difficult to make major investments when public transportation — in general — is going through a decline. When the number of people owning cars keeps on increasing it seems logical to invest in highways and not in expensive subway systems. However, with traffic jams increasing as well, the worst decline for public transportation came to an understandable end. The new era in transportation got started right here in the Bay Area with BART (San Francisco Bay Area Rapid Transit), which was initially a nine county endeavor. BART is a highly effective underground system (above ground in most areas outside San Francisco and Oakland), though some people are not too enthusiastic about it. Nevertheless, BART's larger scale has aided the functioning of the city; in the least the system has helped to relieve congestion of San Francisco's business district. Several other cities were looking for similar ways to deliver an alternative to their congested suburban and inner city roads, like Washington and Atlanta, where systems like BART were built. These modern subway systems are very expensive to implement. Yet once implemented — functioning in a fully controlled environment — it has benefits in both speed and cost. The Bay Area would literally stop functioning if it wasn't for BART.
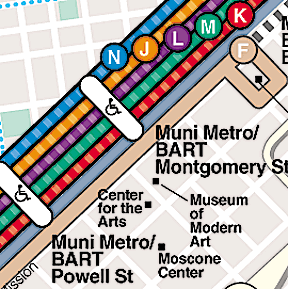
San Francisco's Muni got something out of the creation of BART. First BART had plans for a second line to reach San Francisco's downtown from Marin, yet that Marin BART never materialized. The plan got abandoned, but in the downtown area of San Francisco a tunnel was built with two layers of tunnel and stations. Muni became the proud owner of a subway. To connect the four stops underneath Market Street and the Twin Peaks tunnel a new section with three more stops (Van Ness, Church, and Castro) was dug between Civic Center and Eureka Valley. It cost Muni time, money and effort, but when it was finished in 1982 Muni Metro was born. Top
Muni Metro
Such is the historical time line leading up to Muni Metro. The Municipal Railway superseded the various streetcar companies, it then had a hard time holding on to its streetcar lines from the 40's on, and got a tunnel underneath Market Street when BART came to town. Before coming to the choice Muni made what to do with this tunnel, let's introduce some often used standard abbreviations in public transportation first. Vukan Vuchic mentions that there are four forms of guided rail. First there is the trolley bus. Then there are three forms of rail tracks on the ground: the streetcar system (Light Rail Transit), the Rapid Rail Transit (subways, metros, the El), and RGR (Regional Rail). BART fits the middle category but also shows some characteristics of the RGR. These forms of rail all function so much better than the bus, but they come at a price. To implement the rail systems, very large investments are required. Investments need to be made for tracks; subway systems need expensive underground stops or stations, tunnels, adjustments to roads. Investments of this extent do not exist when implementing a bus line. Just the bus, the bus stop, and the maintenance location for the buses and the buses themselves, and you are done. Buses are cheaper to implement. The downside is that people tend to like rail a lot better.
Transferring from one bus to another is not very much appreciated. Pushkarev and Zupan conducted a major study of transit and found that per capita travel by bus in U.S. cities that have no rail modes is in general lower (and never higher) than per capita travel by bus in cities that also have rail modes of public transportation. This means that people are willing to transfer more when parts of their trip takes place by rail transit. The synergy effect of transit improves when the trip includes a more desired mode. It may then not come as a surprise either that people like transferring best when their trip consists of two modes of rail. A higher service is delivered by streetcar (LRT), with an even higher service delivered by RRT and RGR. More shaking takes place by bus than rail, while the bus also stops more often and is slower in general. Transportation by rail improves the identity of the organization, and aids the overall performance of public transit. It also has a major impact on the urban development of a city. The permanence of a station influences many investments and land use decisions in their vicinity. The same study by Pushkarev and Zupan showed that cities with public transportation on rails add more office space to their downtowns than do cities per capita of similar regional populations without rail. A recent study showed that the vicinity of a BART station had a clear diminishing effect on people owning a car, while Muni LRV-stops did not show that effect. A clear conclusion is that when a city is seen as an economic product, this economic product becomes better — and is better liked — when good rail service is part of the mix, and that well created transit stimulates people to use it.
The synergy effect for each form of transit is different. The synergy effect can be explained as the extra number of people transit creates when lines connect to other lines. Two non-connecting bus lines will transport fewer passengers than two similar bus lines that cross each other's path. From the report it can be distilled that for two connecting bus lines the synergy effect is still lower than the synergy effect of a bus and a streetcar line connection. A Dutch report mentioned that in comparison to the private car the bus receives a preferred percentage of about 30%, while LRV is considered a 70% match to the 100% benefits of your own car. Metro and national rail received a 90% comparison rate.
Rail service comes at a price, but delivers a better product (though modern grade separated bus lines appear to have similar benefits as well). There are more differences. According to Vuchic "the planning, construction, and operation of rail transit require considerably higher expertise than bus transit; as a consequence, agencies utilizing rail modes usually have a higher degree of transit expertise than those utilizing buses as the sole transit mode. This is an overlooked — but very important — factor for urban transportation planning and the role that transit plays in the city in general."
The people involved with rail are different from the people involved with buses. Vuchic only mentions the difference of degree of transit expertise between both organizations. The differences in level of expertise required for the various forms of guided rail systems are not specifically mentioned. However, he does offer enough evidence to illustrate that a different degree exists between LRT (Light Rail Transit) on the one hand and RRT and RGR on the other. First of all, the major difference is that RRT (Rail Rapid Transit) and RGR (Regional Rail) operate in a fully controlled space. No other traffic interferes with the subway or train. It is true that the LRT or streetcar may operate partially on a reserved or fully grade separated right of way, but large segments of the lines are on the street and in between other traffic. This is a very important distinction. Muni Metro may still improve on its 9 mile/hour, and its 15 seats per line/mile, BART already speeds underground at 28 miles/hour, and has 42 seats per line/mile. An obvious difference is that streetcars often have a maximum of three cars to a train, while subways usually have four to ten cars to a train. Stops are also further apart with subways. LRT has fewer beneficial results in both speed and cost than RRT. From Pushkarev's same table one can read that LRT of the MBTA (Massachusetts Bay Transportation Authority - Boston) and SEPTA (South Eastern Pennsylvania Transportation Authority - Philadelphia) deliver similar less beneficial outcomes compared to their respective RRT counterparts.
There is another clear distinction between the specific functions of bus and LRT on the one hand and RRT and RGR on the other: bus and LRT-lines may be seen as independently functioning lines while subways normally do not exist without bus- and streetcar lines feeding passengers onto that subway system. Rail Rapid Transit is by nature a dependent system that cannot live off of just the people in its vicinity, and as such RRT is a mode that belongs specifically to larger scale economies. RRT is not a system you can implement anywhere you want. An RRT line should only go into suburbia when it is populated enough. Paris, for instance, has densely populated suburban areas where metro lines — enhanced by feeder lines — can indeed serve large amounts of people. In general, American suburbia is only good enough for bus service. However, the sooner several bus lines can hook up to an RRT line, the more people will make use of the bus lines. RRT (like BART) and RGR (like a High Speed Rail) do not function well with just a bunch of parking spaces outside the stations; they need the right mix of significant suppliers and desired destinations.
The last but nevertheless important distinction to be mentioned here is that the structural choice on how to use the infrastructure is more vital in grade separated systems like RRT and RGR. The choice on the number of lines that can make use of a single track influences the outcome in a negative way: the more lines the lower the outcome of service and speed. The physical condition of a tunnel provides a set of circumstances under which it will perform optimally. The more lines the lower the average number of cars per train in the tunnel; which especially occurs when the lines also operate above ground in traffic. Then, the physical condition of the station also provides a set of circumstances under which it will perform optimally. The more tracks and platforms in a station, the less this station will restrict the performance of the tunnel. That's why train stations have a fair number of platforms and tracks: to minimize obstruction of the single line that runs between stations. The managerial handle in RRT and RGR is therefore different from the handle on LRT. Because streetcars perform under many circumstances that cannot be foreseen it is wise to just go for the max of whatever is possible. But metros and trains operate in controlled circumstances which delivers the option to fully maximize the potential of the line.
When Muni Metro was in full operation in 1982 more passengers started to make use of the streetcar system that now went quickly to the downtown area underground. More trains were put on track and all too soon it became obvious that success had delivered a problem: full capacity of the upgraded streetcar system had been reached virtually overnight. Worlds had started to collide. Muni Metro — a streetcar system only half changed into an underground metro system — created a success that could not be sustained by the very same system. Shared tunnels with limited stations were run as if they were part of a streetcar system. This time/space crunch lead eventually to the implementation of the ATC in order to speed more trains through the tunnel and back. It lead to the creation of Muni Rescue. It got Mayor Willie Brown elected on a promise to fix Muni. It resulted in much waiting and aggravation for regular San Franciscans. And naturally it cost lots of money. Internally the blame game got played, involving unions that were too strong, inappropriate cronyism at city hall appointments; it caused Muni being moved from one department to another. You name it! I prefer to think that all were important but that one thing in particular was overlooked or purposefully not implemented: scale of economies. Both success and its inherent jumble of failed expectations were signs of an incorrect decision made in the past to not specialize and not benefit from a controlled environment.
Sometimes, it may be hard to see what is going on right in front of our eyes. To the outsider the difference between a streetcar system and a subway system may have been clearer. An outsider might have noticed that the heart of Muni's system was not built on its full potential; that it had flaws. In New York and Chicago truly no other choice could have been made than to use such a tunnel as a metro. Otherwise managers would have been pulled of their jobs fast. In big-yet-small San Francisco it was still possible to make the choice to keep the streetcar system intact — that is, until success arrived. Top
Scale Economies
A streetcar system is one thing, a metro system is another. A Muni Metro system is truly yet another thing. A combination of two successful systems does not automatically lead to a fully successful combination as well. A combination may be the exact opposite of the road to success and Muni Metro is a historical point in case. The distinction between success of two separate systems and the failure of a combination of both can be made clear through economy of scales. Separate functions deliver a larger benefit to the system as a whole than when the functions are integrated. It is the 101 in economics; it is the reason why capitalism is so successful. A short streetcar on the streets — encountering more obstacles than when run in a subway — functions differently than a metro, and will also cost more per passenger to operate. By combining both forms of transit, the metro segment is not allowed to grow to capacity because there is a wait for the irregular and little cars to come into the tunnel, while the streetcars are not allowed to grow to capacity because they are limited in entering the single tunnel they need to share with other lines. It may appear to be clever on paper to integrate two systems into one, but the economic reality is that there is a better result when systems perform their own tasks independently. Adjustments can be made to the particular circumstances when both forms of rail function separately. Unhindered, both systems have their maximum point of performance that lies beyond a combination like that of Muni Metro.
A simple example will show how specialized independent economic activities deliver better results. If you are already convinced that making use of scale of economies delivers a better result, jump ahead.
There are two people, person I and person II, and they both make two products, product A and product B. For both, it takes one hour to make product A, but to make product B each person needs a different amount of time. Person I still needs one hour to make product B, but person II is much faster making that product. That person can make 3 products B in one hour.
| Producing | person I | person II | total |
| product A | 1 per hour | 1 per hour | 2 products A |
| product B | 1 per hour | 3 per hour | 4 products B |
| total | 2 products | 4 products | 6 products |
Person I spends two hours on producing both products (A and B) while in those same two hours person II can produce 4 products (A and 3B). After two productions hours these people have made 6 products all together. It appears that there is no benefit for either person to start trading product A, because person I can make that product as fast as person II. But let's look at product B. Person II is much faster at producing that product: three times as fast. Now scale economies are coming into play and we will see the benefit when each function is performed separately.
Both persons specialize when they each start to produce only one type of product. Person II is fastest when making product B, so that person will make product B. Person I is therefore going to make remaining product A. After two hours of production these two people have now made 8 products in stead of 6. The total production is larger in the same amount of time when each person specializes than when each tries to make both products.
| Producing | person I | person II | total |
| in 2 hours | 2 product A | -------------- | 2 products A |
| in 2 hours | --------------- | 6 products B | 6 products B |
| total | 2 products | 6 products | 8 products |
This is not the end of the story because they will have to trade with one another. They both need the other product as well. They are willing to trade at a rate of 2 products B for one product A. In the end both persons have more than when they had not specialized.
| After trade | person I | person II | total |
| 1 product A | 1 product A | 2 products A (made by person I) | |
| 2 products B | 4 products B | 6 products B (made by person II) | |
| total | 3 products | 5 products | 8 products |
Person I, who made two products A, trades one product A for two products B. Person I ends up with 3 products in total (the A that wasn't traded in, and the 2 Bs traded in for one A), while person II ends up with 5 products. (Person II got 1 product A in exchange for 2 product Bs). Therefore both benefit. The benefit that person II had (being faster in producing product B) translates into both benefiting. Person I has one extra product B and person II has one extra product B.
From an economic point of view it is better to have independent functions than integrated/dependent functions. Not having to wait for another part to finish means a specialization stops only at the maximum of its own potential. Let's explain scale of economies with an example taken from reality. Naturally there are more than 2 players, but let's concentrate on just 2 segments and see why both benefit from independent specialization. A tax agency is better focused on tax laws than — say — a paper manufacturing company. The tax agency delivers these services at a higher quality, a higher speed and far better price to the paper manufacturing company than when this paper manufacturing company starts to do its own taxes. Less money is spent by the paper manufacturing company when the tax agency takes care of that part of the business. Though the paper manufacturer must pay someone else, the time it takes the paper company to file their own taxes saves them less money than when they out-source it and stick to what they do best themselves: making paper. With wasting time with what they are not good at (and at the same time being unable to do what they do best) they end up losing more money than when they pay the taxman.
True — the benefit for the paper manufacturing company may not seem to be much, so let's look at the other side of the picture as well. The tax agency cannot be bothered to make their own paper. It will truly cost the tax agency a whole lot more money to start making their own paper than the money they can make filing other peoples tax returns during the same amount of time. It is a lot easier for them to just buy those reams of paper than make the paper themselves. Here, there seems to be a very obvious benefit, involving a large amount of money for the tax agency. But that's not where it ends: the tax agency can use this extra benefit to lower their price further which in turn will benefit the paper company. Why will they lower their price? Because otherwise a competitor will step into this market. The apparent benefit one side has eventually benefits both sides.
Both companies can and will invest in special equipment and training to enhance their own performance. The paper company will buy that large machine to make more paper, ultimately bringing the price down per sheet and thus selling more paper. The tax agency will hire that more expensive taxation specialist because they can make use of his or her special skills more often, and get a better name for themselves and therefore get more clients. Clearly the specializations pay for themselves. Both companies have a clear advantage by concentrating on what they do best, and both receive an extra advantage when they make use of what others do best.
Both companies are seemingly unconnected organizations — sudden troubles, for instance, with manufacturing paper do not immediately trickle down to stop processing tax returns. Both perform at their possible best, and problems with one do — in the short term — never affect the other. By being independent entities, both companies will have a top (political) organization that is focused on their own field of expertise, and both organizations are able to make the most beneficial decisions possible for themselves, and will deliver a financial benefit to the ones making use of their services.
The last step to understand scale of economies is that there are not just two players in the game, but several or even many. And that is very important. The demand for the paper manufacturer is so great, they can do what they do best all of the time. However, not a lot of people need the tax agency all of the time. So the size of the location matters. In a village the tax agency is not busy all of the time, so time is spend idle — or time is spend on doing something else they are not good at. In a big city, the tax agency is busy doing what they do best all of the time. By specializing and by doing it all of the time the largest benefit is achieved; both for the tax agency and for the persons or entities making use of their service. The larger the city the more the specialists can do their specialized thing all of the time, and therefore the larger the benefit for all. In our modern world in which connectivity has improved dramatically, it has become less important — but not unimportant — how far away the clients are.
There is one very important distinction inherently connected to the set up and use of scale of economies and which is the dark side of capitalism as well; as political entities that must keep both their eyes on just their own field for the best result, specialized organizations will not make decisions that are beneficial for society as a whole unless it also benefits themselves. In short: most organizations have a blind spot which enlarges in scale of economies. To operate as well as possible they must be 'selfish' or to say it differently they must be economically self-absorbed. They will respond to the outside world with specialized actions that must benefit themselves or take actions that prevents the competition to surpass them. The outstanding benefit for society is that a close match will occur between the chosen model and that what society truly needs from this specific field. A lean and at times even mean organization will result. The down side is that all organizations must follow the self-absorbed rule of operation to succeed. All will hold down their own forts. Especially when society has no competent umbrella organization (government) to direct all forms of economy to also help those in need — and with the companies too much involved in their own little world to notice that the larger picture has become a picture in which some people have become unimportant — more and more people will end up falling between the cracks. Though capitalism is one of the best way to discover the best production for society, capitalism also has a less humane side that can be resolved by also having a well-regulated government. How to get a well-regulated government? Well, let's say that that is another story; but some countries are clearly capable of creating a well-regulated government that is good for all while other countries seem to have governments that prefer to shoot in their own foot which ends up being wonderful only for some special interest groups.
Capitalism does not have a patent on scale of economies; but it is better or quicker at implementing the economically most sensible options. In general someone in a competitive field will implement that most sensible action sooner than someone in a more restricted society. At first such capitalist behavior was found in public transportation as well. During the first years of the streetcar many local companies competed for public in need of transportation and it was not unusual for American cities to have a different streetcar company operating in every other downtown street. The particular scale of economy was functioning really well for these companies because there were many people dependent on this form of transportation. San Francisco's cable car company started to exist in just such an environment. Yet this was not the cheapest or best way to go — not even in those days — in as far as the scale of economy for the whole of society was concerned; by operating on a larger scale lower cost per passenger per mile could still be achieved — as is made visible in the developments of the El's and subways in New York and Chicago. Companies and passengers benefited of faster, larger scale operations where the cost per passenger went down. Public transportation industries were developing the best available economic outcome wherever possible. Unfortunately, San Francisco did not make it to that level in time during the glory days of public transit.
In our days — with the car and the airplane being the main form of human transportation — there is no stiff competition in public transit anymore. It is no longer feasible. Public transportation is widely seen as a societal good and public support is therefore required to maintain that societal good. This means that there is often just one organization for very localized transit, and just one for regional transit. Not the market, but the subsidized organization decides what form is given to the public transportation operations. As such, Muni has become an organization that is no longer guided by the needs of the passengers and the financial bottom line, but by the goals as written down in its manifest.
The particular decisions made by public transportation agencies can no longer be surpassed by their immediate competitors because there are no immediate competitors anymore. The creativity, the learning skills, and the knowledge spillover effects that often coincide with booming economies are not immediately available in the more 'depleted' economies of public transportation. The focus of management may get fixed. The decision made is now the decision that stands for a long time, subsidized and all. Penny wise decisions may in turn deliver pound foolish results in that quick but momentary savings can cost a lot year in year out. Though the organization is dependent on outside money, it has become harder to control and influence from the outside. From the outside, one can feel powerless. If all goes well, all is well. Yet when an imperfect situation is established, that situation can remain in place for a real long time.
The choice to not have the Market Street tunnel become a metro has many economic consequences. A more clogged up system is a slower, less desired system. Fewer clients means less revenue. The streetcar system that should be a faster mode in theory is fairly slow in San Francisco due to the busy streets, regulations, and the sharing of a single tunnel. Many more people could be using the tunnel. Once the trains are in the tunnel they are pretty fast, except for the morning commute when the system should function optimal but doesn't, and throughout the day, when Muni has people waiting unnecessarily at the downtown platforms for their own particular train to arrive that will take them home. Especially at night the wait can be gruesome. No metro system in the world delivers such minimal service. Unfortunately Muni's management does not get the message — at least not well enough. The fact that Muni has the highest load factor (how many people are on board) in the industry is a give-away. What would happen if the Market Street tunnel and the Twin Peak tunnel became a separately functioning independent metro? Top
How Muni can get more service for less money
When Muni received the tunnel underneath Market Street, Muni 'made' the choice not to specialize this segment. While Muni did decide that it was beneficial to have the Market Street tunnel be connected to the Twin Peaks tunnel, it did not choose to have the subway be just a subway with express metroes that complemented its bus and streetcar system. Today, no expensive investments are required to significantly enhance the situation in San Francisco. Except for location specific adjustments, such as for instance at West-Portal, all is in place, since all tunnels have been dug, and all stations are capable of receiving longer trains. In an experimental way, San Francisco could have express metroes running today. While not delivering all specific aspects to this plan (since many specific variations to this plan are possible, and engineers and planners would certainly make very specific remarks and demand adjustments), a more general overview can be delivered that shows the essence of how the city can get a real subway, how the citizens can get reliable express metroes, ánd how money is saved in the long run. In Table 1 (PDF) the situation of the year 2000 is shown as the top half of a table that shows Muni's five streetcar lines. If you were manning the computer screens of the system, this is the average result you would see during the morning commute in the year 2000. Follow the N line, for instance, and — on average — you would see 3.5 N-trains in the tunnel, 9 above ground, and the yellow layover shows 2.5 N-trains waiting to get back into service. The grayed-out area depicts the 2 N-trains going to Caltrans (not part of the calculations). Some information is no longer current. However, the general idea is still very much intact. Today — as then — five separate streetcar lines (N, J, K, L, M) feed into a single tunnel. Three streetcars (K, L, M) enter the tunnel at West-Portal, while two lines (N, J) enter the tunnel later — between Church Street Station and Van Ness.
Place this result next to the Reshuffled situation (shown right underneath in the same table) in which no streetcar is allowed to enter the tunnel. Instead of the complex streetcar system making use of a single tunnel, the tunnel has now become a subway all by itself — the single orange track — something that will look like a BART (but which is operating on the Muni-tracks) and that runs 14 times every half an hour; cars above ground do not enter the tunnel anymore, and trains in the subway stay in the subway. Above ground the streetcar system is still intact and 4 lines (N and NJ are partly on the same tracks) help deliver passengers to the subway. People currently using the N line, for instance, can use either the N or the NJ in the Reshuffled situation to get to the Church Street Station and transfer to the underground which gets there every two minutes — in this case each metro consists of three cars. The LM line follows the tracks above ground of the L and the M. If you add up the white areas of the L and the M of the top of Table 1 you get the same amount of white area for the LM in the Reshuffled situation in Table 1. Some time is saved because there is only one yellow layover space for the LM where there are two for the L and the M. This Reshuffled situation shows the increased capacity of specialization. In reality some adjustments may turn out to be practical, in reality some other choices may make more sense. Yet the general benefits do materialize.
The enormous potential in savings (in money for the organization and time for the passengers) in scale economies for the Market Street tunnel are delivered in this Reshuffled example. First, by reshuffling the cars, it becomes visible that each surface streetcar stop is still serviced by at least the same amount of cars per hour, yet eight drivers in total are no longer required to deliver the same service (53 drivers instead of 61).
Second, to show the advantage for the tunnel the service is broken down per hour in Table 2 (PDF). The top of table 2 shows the same capacity service delivered per line for the morning commute in 2000, but this time on an hourly basis. The N line of 15 trains (times 2 car, as was shown in table 1) is stretched out over close to 1.7 hours, delivering an average of 8.91 train per hour. The system as a whole has therefore 67.2 cars (divided over almost 42 trains) running per hour. For the tunnel this meant that a 100% capacity was reached for the year 2000 during the morning commute (before implementation of the new ATC system). The most important downside is that — with the tunnel being at maximum capacity — the streetcar system as a whole had reached its maximum point of capacity.
Again, the Reshuffled situation shows a different result right underneath in table 2, and here we can see more of the basic workings of scale of economy: there is a much greater capacity when the trains that run in the tunnel have three cars each instead of one or two. By not having to conform to outside influences it runs smoother/uninterrupted. 42 cars in sets of three form 14 trains that zoom through the tunnel twice an hour (which makes 28 trains/hour). The 14 drivers required deliver more service than the 42 drivers of the 2000 situation. Above ground the streetcars run according to their own rules and capacity. During the morning commute the N delivers 5.60 trains per hour towards Church Street Station, while each NJ has two moments of delivering commuters to the Church Street Station; once from the direction of the Avenues, and once from the direction of the Streets. The capacity for the LM line exists also in two directions — both directions moving towards (in the morning commute) and away from (in the evening commute) the West-Portal station. LM's 9 trains of 2 cars are therefore totaled in twice (9 x 2 x 2). Notice how the top in Table 2 only shows one flow per line toward downtown, while the Reshuffled version below has several lines with two flows drawn in it. Mind you, this Reshuffled figure is still based on the 100% capacity of the 2000 situation. Though more space has become available to put more trains on the tracks, the above ground part mimics/slightly improves the level of service of 2000. So, 76.88 cars are effectively at work above ground to deliver commuters to work. In the tunnel, where first 67.2 cars/hour meant that 100% capacity had been used, now the tunnel capacity of effectively 84 cars per hour can still be doubled. Above ground the potential is even higher, though less of a necessity. Both the subway and the above ground situation already deliver a higher use, while the total numbers of cars in use is still only 100 in this example.
Each underground station receives 16% more cars (there are fewer but longer trains). A big plus for the passengers is that they can take each and every train. Especially during the commute hours people will never have to wait at the subway stations again. This is true all over the world and explains the enormous popularity of subway systems in other cities. There is virtually no waiting; transferring has lost its terrible edge with a metro line because it represents continuation, not stagnation. In the reshuffled situation the system as a whole uses no extra cars (again, both versions use 100 cars), but eight drivers are no longer required. A greater capacity in the tunnel has been created, where fewer drivers deliver more. This is economy of scales in action. Specialization makes each segment stronger. One segment that may not be able to do a lot more (the streetcar system) still benefits from the specializing power of the other segment (the subway).
The situation of Muni for the year 2000 shows the maximum capacity of the streetcar system. While the current situation has been improved by the implementation of the ATC system, the full capacity of the tunnel is still only somewhat more than what it was (21% change over ten years). By using the tunnel section as a subway — and nothing else — the true capacity of this tunnel is 250% its current (2000) use. With the highest load factor in the industry, Muni should consider updating its rail service. The capacity of the tunnel itself is far, far greater than what it is used for today. Each train that stops can be full length and every person moving along the line can take it. Having reached full capacity during commute hours (either in the 2000 situation or today in a new full capacity setting) means that the overall Muni system is both functioning at its limits and paying a high price to maintain this level of performance as well. Significant savings for Muni are obtained when passengers make part of their trip under less costly conditions. Instead of many bus drivers or streetcar drivers transporting a limited amount of passengers during a hampered commute, fewer metro drivers can transport a whole lot more passengers comfortably to their destination. Even when only one part of the trip is done in a faster, specialized way, savings for Muni and passengers can be significant in money and time. On top of that, the metro can become the heart of the system that is as reliable as any metro system in the world. Even the hamperings of the ATC system (like the implemented and thus structural waiting periods in the tunnel) would disappear for good. While the bus is currently the most used vehicle, such a metro could start to vie for first position in delivered passenger miles.
There are more benefits to scale of economies. In the future, Muni could order true subway cars instead of the very expensive Breda cars. All that the subway cars need to be is subway cars. By not having to mechanically move steps up and down (as is the case with the Breda cars) significant savings (60%) can be achieved, while these cheaper and specialized cars can also hold more passengers than the Breda cars can. The 250% capacity — mentioned above, showcasing the tunnel's true capacity as a percentage of the use in the year 2000 — could even be improved. This requires future investments not in more Breda cars but in far cheaper subway cars. The Breda cars no longer needed for the tunnel can then be used on the streetcar lines. Future investments — that come around anyway — can be made in specialized products that deliver more and faster service.
Muni is not the only organization to benefit from a strongly performing Muni. BART could benefit as well when Muni's core performs better. People inclined to use BART may decide to not take BART because part of their trip is dependent on a hampering or overcrowded Muni streetcar. To transfer at the Embarcadero after a swift BART-trip from the East Bay, waiting for more than five minutes for your specific Muni connection is a turn-off. Often, the wait is much longer. Yet a passenger getting into town may take BART to the new Metro. Not much waiting is involved before the metro car arrives and which takes the passengers all the way to West-Portal. Here the LM-line rides more frequently than was ever possible. The total waiting time has been cut in half for this passenger, and the trains were faster too! The synergy effect of two well-performing rail modes is high.
Below ground a separate metro has benefits, above ground the streetcars also have their benefits. And there is yet another benefit. Vukan Vuchic says: "RRT requires the highest investment costs, but have lower operating costs than any other technology. The marginal cost of providing additional capacity is much lower than on any other mode." He clearly states about RRT: "Off-vehicle fare collection, simultaneous boarding/aligning allows this mode to provide rates 3 to 5 times greater than LRT and 10 to 20 times greater than those of buses." Not only was the most expensive form of public transportation dug underneath Market Street (the tunnel), on top of that the choice was made to exploit it in a more expensive way as well (a streetcar system).
If Muni would reverse its model from today's outside-in (Muni-Metro) to an inside-out model (with a separate metro line plus separate streetcar lines) the level of quality in speed and service could improve drastically at a lower cost. Today, the outer ranges of the city receive a high quality mode to the downtown area by streetcar, but the lines swamp the available infrastructure downtown (Market Street tunnel), thus delivering a distinctively lower quality to the center of the Muni system. By reversing the model the center would deliver the highest quality service (a single fast metro line), while still maintaining the best quality available for the outer ranges (the streetcar lines).
Let's talk about the only downside, which is that in this model passengers have to get off their streetcars and transfer into the subway. The truly delightful moment of not having to transfer is lost here. Nevertheless, the overall quality of the Muni system improves dramatically. Unlike today, the heart of the system will become the most sturdy part of the system — operating in a fully controlled environment that can handle even a strong increasement in the passenger flow. The loss of the quality A moment of not having to transfer at West Portal may therefore be definitively countered and overshadowed by the overall improvement of Muni. Even Muni's current streetcar system contains many situations where there is no quality A transfer moment: the spaghetti situation at Balboa Park Station for instance, or the fact that passengers have to wait a long time at the Market Street metro stations for their particular metro to arrive, or even the time spend waiting inside a streetcar to get inside the West Portal station. While the quality A moment of not having to transfer at a particular point may appear an argument for retaining the Muni Metro system as it is, the equally important quality D transfer moments throughout the system are then taken for granted. If Muni gives up on the idea that transfers need to be avoided at all cost (and/or not addressed), it could then focus on creating high quality transfers passengers can accept. A more smoothly operated system is then possible. Today's outside-in model lowers the service level at the center, and lowers the level of the whole .
Implementation of this specific economy of scale has one more benefit. Because maximum capacity is reached in the current situation, solutions for other problematic parts in the city will never, ever consider the Muni Metro Market Street tunnel as part of their solution. Suppose a new surface streetcar line or Rapid Bus (for instance, for the 38 bus line) needs to be implemented. Some plans mention digging a tunnel to make a connection with the down town area. Why not have it take Webster where it can make a swift connection to the Market Street tunnel. Right now you wouldn't even think of it: the capacity of the Market Street tunnel is traumatic at best during morning commute. Nothing significantly can get added. The Market Street tunnel has currently one big billboard announcement for public transportation planners, and that is: Stay Away! With a smoothly running subway system in that tunnel, other problematic parts of the Muni system may be redirected to that subway. Such a '38' streetcar line would not have to go underground underneath expensive downtown grounds (though some tunneling could be required for a smooth transition around Church Street station) saving a lot of money in yet another way. Several bus lines could be redirected to deliver passengers to a tunnel that has 250% more capacity. In short: by making the Market Street tunnel the best it can be, it becomes the most reliable and most efficient center piece of public transportation in San Francisco next to BART; as such it can attract more riders and absorb more of Muni's operations. Top
Comparing Muni
Muni (and its predecessors) never developed to the level of its counterparts of public transportation in Chicago and New York because San Francisco wasn't a big enough of a city by the time the automobile had become popular. These very large cities may therefore not be the best places to find a good comparison for our own public transportation organization. Another argument one could use against comparing cities is that cities are nothing alike — it is especially hard to find another city like San Francisco. What other method is left available to figure out how well Muni is functioning? In the old days free market competition ensured a close match to what was economically feasible and what the public transit organizations were delivering. Today, Muni has no competitors of which it needs to be afraid. The only way for us to find out if Muni is doing what it should be doing is by comparing it to transit organizations of other cities. We need to find a generic table for comparison.
A report on public transportation of Canadian cities in 1999 shows that cost recovery will increase significantly with the size of the city. Fare cover is the percentage of the total operating costs that is covered by selling tickets. Cities/locations smaller than 50,000 people in Canada had a fare cover of 43% in 1999. Cities between 50,000 and 150,000 had a much higher 50% fare cover, while the second largest cities (up to 400,000) even had a fare cover of 56%. A truly beautiful 64% fare cover was achieved on average by cities with a population larger than 400,000. With this report we have obtained a comparable setting of a general order. Not every city needs to be right on the mark, but something close (or at least not something too far off) should give us a quick look at the level of performance of each city. New York City with its 58% fare cover seems to be close to target. It is worthwhile to mention that Toronto has a fare cover of 84%; this incredible outcome may have pulled the Canadian standard of 64% for the largest of cities higher than what should be expected. With only a limited number of cities larger than 400,000 people the 64% fare cover may be a little bit off. However, the 43% achieved by locations smaller than 50,000 people should be most reliable — having been established by many different local organizations.
From a different report it was distilled that Canada as a whole had a 62% fare cover, the United States 56%. The fact that the figures differ somewhat in the two reports (though not the overall tendency) makes it clear that the fare cover figures used throughout the world are only somewhat comparable: some reports include overhead as part of the operating costs, others do not; some organizations charge little for a ticket, others charge more, some get income from selling ad space, etc. There are many, many variations to this theme. An interesting explanation, however, may be that the difference between US and Canadian transit organizations may be caused by just a few organizations that continue to function well below par in the United States. It is possible that the Canadian organizations are held on a stricter leash with nationwide standards, while local control in the United States may in some places have led to less or even non-responsive organizations. That seems like yet another reason to establish a standard measurement.
Despite the differences found in various reports the trend seems obvious. In general, when a city is larger, more people make use of the public transportation lines that are in place. Public transit at the edges of cities is used by fewer passengers than in the rest of the network. Therefore the larger the city, the smaller that edge is as a percentage of the whole. It is understandable that five stops total in a village generate less 'clientele' than 25 stops in a large city with multiple connections at several stops to go elsewhere in town. The use will be higher in the larger city. Still, the closer we get to the edge of the city the more the number of passengers on each line will resemble that of the village with five stops. There is another reason public transportation works well in larger cities because the larger the city the more densification will have taken place (as a generalization). Less money is therefore spent on average per person on subsidies for public transportation operations in the larger cities. From the same generalization we can distill that rapid transit will move the largest number of passengers around in the center of an area. Naturally, the designation 'center' does not have to be identical to the middle of town.
From the above we can determine that it is not possible to deliver the one specific percentage of fare cover that a public transit organization should obtain. Only general percentages seem obtainable. A ball park is available that may or may not do the trick. Yet it is possible to find an absolute number in this morass: the minimum number. Let's make it more than fair and state that a public transportation system in a larger city should be able to have at least the fare cover of a rural area: 40%. This percentage is purposefully chosen to be a low number (even lowered from its 43%) to clearly point a finger to transit organizations that do not perform well. The thinking is that if we can't get a precise number, we can still look for the bad apples. We can then say that if an organization in a large city has less than a 40% fare cover, it should be normal for it to gradually lose its subsidies or get scrutinized until the low performance is clearly understood.
It was not easy to find transit organizations that have more or less the same amount of passengers per year as Muni. I found two in Europe. Zürich and Rotterdam are somewhat comparable to San Francisco. Zürich — with an agglomeration of about 1.2 million people — has truly excellent public transportation lines (about 850,000 passengers daily when including regional lines). Rotterdam — also with an agglomeration of 1.2 million people which is set in a Bay Area-like setting of 8 million people in the Randstad Holland — has several streetcar and metro lines (about 600,000 passengers each day, excluding regional rail).
| Agglomeration | daily local transit | incl. regional transit | |
| San Francisco | 700,000 | 950,000 | |
| Rotterdam | 1,200,000 | 600,000 | |
| Zürich | 1,200,000 | 850,000 |
San Francisco's Muni has also about 700,000 riders daily, while regionally BART takes in another 250,000 onto its system (35,000 with a Muni Fast Pass). With a transit culture that was never depleted of funding and status — in contrast to the United States — innovations found overseas may be applicable or at least be of interest to the San Francisco situation. It may be prudent to note that not all European public transportation is based on simply spending more; capitalistic pragmatism has often worked to save money. Governmental oversight may have also created standards that immediately show which organization is under performing, and strict requirements could have been put in place.
Here is the bad news: Muni's pendant in Rotterdam, the RET (Rotterdam Electric Tramway), does not have a good fare cover: it is only 32% (in Dutch, page 23) of its total costs. [Update, through efficiency changes it now stands at 37%; same page 23.] There is clearly room for improvement. Even so much that the possibility of placing this public transit organization in the Netherlands on the track of privatization has been mentioned; all due to the unflattering results. However, that may be a last resort; with the RET falling below expectations on the nationwide playing field, this organization is now trying harder than before to organize itself better.
The fare cover of San Francisco's Muni is unfortunately not better but worse than Rotterdam's RET. Muni's fare cover is about 25%, while on top of that Muni also receives its electricity for free. We can say that San Francisco is hilly, that there are special circumstances. Yet it will be hard to prove that no significant savings can be made at Muni. To complete this paragraph with both American examples previously mentioned: Boston got a not so good 29%, while Philadelphia got an okay 41%. Michael Burns has done wonders in Philadelphia, so there is still hope for financial improvement in Bagdad by the Bay.
In Switzerland, the ZVV (Zürcher Verkehrs-Verbund), has achieved an admirable 57% fare cover. To get to these good results several circumstances had to fall into place. Zurich has a rather small compact center of about 400,000 people, and the biggest increases it received in recent years were due to the implementation of regional rail, which also helped a rapidly increasing region to have more than a million people. The density of the inner city is rather high, visibly expressed in the fact that 28% of the people travel on foot to get somewhere. The people of Zürich — through an election — made the choice to not separate-grade its city transportation; except for regional rail. The city has therefore many streetcars on the road, which means that it is truly difficult to get into its historical town by car. Both streetcars within and regional rail in/towards town have therefore been given prime position. The new regional rails and the prime position for streetcars have contributed to a successful synergy effect in Zürich. Wonderful results that may indeed be very hard to recreate in San Francisco.
The city of Rotterdam may be more comparable to that of an American city, with its rebuilt American city-grid modern downtown, and larger area. Muni's area stretches out over 49 famous miles, the Rotterdam Electrical Tramway (RET) covers a slightly larger area. Here, a few (basically two) metro lines carry 46% of all passengers, translating into 60.2% of every mile covered by all RET passengers. It may explain why Rotterdam uses fewer operators. While Muni has close to 2200 transit operators (out of a total of 4300 personnel), the RET does not have that many transit operators: about 1400 out of a total of 3500 personnel. Clearly, with high capacity vehicles — like RET's metro — there are less operators for the same amount of passengers. Both organizations, however, are nevertheless put to shame by Zürich's ZVV: it has 1300 operators out of total of 2300. All three organizations carry similar amounts of passengers per day.
| total personnel | transit operators | maintenance personnel | |
| San Francisco | 4300 | 2200 | 1200 |
| Rotterdam | 3500 | 1400 | |
| Zürich | 2300 | 1300 | 700 |
Units of transportation in use in the three cities show remarkable differences: a total of 515 buses/streetcars/metros in use in Rotterdam, 587 for ZVV, (which includes Regional Rail), but an astounding 978 buses/streetcars for Muni. Muni has a tremendous amount of transit vehicles and a lot more personnel compared to these two other transit organizations that transport the same amount of people each day. Zürich's ZVV (56% fare cover, 2300 personnel) has the leanest company in two ways: the bulk of its personnel is actually operating a transit vehicle or maintaining it (2000) and they have the least amount of personnel — period. Compared to Muni, the RET was able to deliver the same service with less vehicles by having the subway system be its backbone. In Rotterdam there were 244 buses in service, where Muni had 785 buses: a difference of 547 buses. The RET had 118 streetcars, Muni 136 (193 including cable cars and historical cars). And then the RET also had 153 metro-cars. Though there are more bus vehicles in service in Rotterdam than trams (streetcars) or metro's, they account for the least amount of passenger kilometers. Each separate metro line delivers more passenger kilometers than either the whole bus or tramway section. It is clear to see that while Rotterdam has a backbone with its metro, Muni Metro is only the backbone on paper. The fact that the RET still only has a 32% fare cover may be explained by the total number of employees. When comparing the RET to the ZVV, the RET clearly has a much larger overhead too.
| Buses | Streetcars/LRT | Metro/RRT | total | |
| San Francisco | 785 | 193 (incl. cable & historical cars) | - - - - - - - - | 978 |
| Rotterdam | 244 | 118 | 153 | 502 |
| Zürich | 241 | 346 | - - - - - - - - | 606 |
Making use of scale of economies has proven benefits. Toronto, with its high fare cover, had made the decision in 1972 to preserve — and systematically expand — its streetcar system; it now has the busiest fleet on the continent. However, from a moving target like public transit no exact science should be expected. The devilish details of the results can sometimes be explained through opposite reasoning; different political colors or unmentioned transit love affairs may (in)correctly alter each vision. Yet a general picture can most certainly get established. It is a fact that Muni has a Load Factor (measure of crowding on board a transit vehicle) that is among the highest in the industry. It is a fact that Muni has a lot of personnel, and it is true that Muni uses many vehicles with limited capacity. It has a tunnel that is operated as part of a streetcar system. Its fare cover is one of the lowest in the industry. Without a doubt Muni can do a lot better. Top
Recommendations and conclusions
Muni's functioning would improve a lot if the choice was made to establish a fast metro in the tunnel from Embarcadero to West-Portal. Streetcars would no longer enter the tunnel (with as possible exception the N). No investments are required because everything is already in place. The capacity of the tunnel is 250% of the use in the year 2000. Metro cars could be bought at 40% the price of Breda cars. People would save twenty minutes a day in commute time. Other bus lines could be redirected to this tunnel for a quick transfer of passengers. A transitional period may be required to smoothly separate this Siamese twin of metro and streetcar. Scale of economy delivers a strong theoretical foundation, while many examples from reality support it in practice.
Imagine how hard it is to say that Muni is not doing a good job. Just look at the sheer amount of people taking Muni everyday: it shows how important Muni is; it shows how much it does function as an integrated part of San Francisco. Yet the issue is not whether Muni is expendable or not, the issue is if Muni is doing the best it can. According to the San Francisco Civil grand jury in 2004 Muni can still improve a lot. Naturally, complaints are colored: most people will agree that compared to Phoenix, San Francisco has truly excellent public transportation, but comparing it to other world cities, Muni is performing too far below its possibilities.
Next to the above mentioned specific recommendation on Muni Metro, a conclusion from a wider perspective is that Muni's organization may be based on an outdated model. By not delivering fast transit where it is needed most, the overall performance becomes lower than needed. Muni also has low connectivity: one has to walk too far to connect to the next line, while especially bus lines have too many stops. Seemingly almost anything was done to prevent people to transfer instead of creating situations where transferring is hardly intrusive. Most of Muni's bus lines deliver service from one side of the city to the opposite end of the city; clearly they were not planned to deliver an optimum service but stopped where the city stopped. Compared to similar cities San Francisco's public transit is slow (many buses) and it does so at a tax payer's price that is high (many drivers/maintenance). Muni's overhead is large as well.
In most cities in the world you find the highest quality public transit at the center, where you are sped away from the center. Then part of the passengers need to get into a lesser form of transportation be it bus or streetcar, but these forms of transit all perform at their very best also. The best of the subway is matched up with the best of bus and streetcar. In San Francisco one starts out at the center not performing at their best and only at the edges of town does one come across the expected level of performance. The waiting and the operation crunch in the center of town are highly unusual.
I would like to end with an already used quote from Vuchic, "the planning, construction, and operation of rail transit require considerably higher expertise than bus transit; as a consequence, agencies utilizing rail modes usually have a higher degree of transit expertise than those utilizing buses as the sole transit mode. This is an overlooked — but very important — factor for urban transportation planning and the role that transit plays in the city in general." Top
Cuts & Pastes
How come Muni did not seize the historic moment and implement a subway line when it was actually doing just that: building a subway line? While Muni can boost a large diversity of modes of transportation, they were — simply put — not a subway organization. Another major reason was that San Francisco's population also resisted a plan (which was truly not well planned) in which replacement — not augmentation — of the streetcar system was sought.
The synergy effect of transit connectivity means that the better the connection between two transit lines the better both lines will perform to their max. All over the city there are situations where one has to walk one or two blocks to get to another line. The Transbay Terminal is not located on the hottest line in town: BART. One has to walk a full block in a busy downtown area, which is a big turn off if you are lugging some suitcases with you. The best connection a transit line can ever make is not to a specific location (like the Transbay Terminal) but to the highest form of transit that is around (BART plus Muni's underground). Even the decision to have the High Speed Rail come to San Francisco (at that Transbay Terminal) is one of those decisions where the connectivity of public transportation may still be compromised. From an economic point of view, the heart of the BART system in the East Bay would have been the most constructive decision; more passengers would use HSR and therefore more passengers would use local transit. There is a downside even to the downtown area of San Francisco if this city got the station: the connection of the HSR to Sacramento — which is a must for the Northern Bay Area — can get postponed and postponed due to the jump such rail line must make across the bay if it first goes to San Francisco. No such problem exists with a HSR station in the East Bay. Los Angeles will get the advantage to get a good rail connection to both the Bay Area and Sacramento, while the trip from San Francisco to Sacramento via San Jose and South of Merced delivers no benefit — at all. The East Bay location (with a no-hassle BART connection from San Francisco) connects extremely well to the South Bay ánd Sacramento, and benefits San Francisco better than a station at the Transbay Terminal. The heart of the High Speed Rail system (between Merced and Fresno) may even become California's next Silicon Valley.
For instance, when streetcar use is truly high, a metro line becomes more feasible. Even when it involves only one line it would make sense to deliver that higher service. It is not good to compare San Francisco to Paris. Paris has 'independent' metro lines left and right that — together — deliver an astonishing service. The sheer number of passengers makes such a model feasible, and the synergy effect of metro connectivity is high. In San Francisco, transit must rely more on buses and streetcars, but the same setup of independent lines as in Paris fails here because of its ingredients — buses and streetcars. They are not fast like a metro. The synergy effect of bus connectivity is low, and though the synergy effect for streetcar connectivity is normally higher than that for buses, in San Francisco it amounts unfortunately to the same level as the bus. Whenever possible Muni should seize the moment and implement a single fully grade separated line on the most successful sections in town, and change its structure from equal level of service all over town to specialized step-graded service.
As BART is showing, by performing unhindered at high speed with a large capacity per train (especially during commute hours) its specialization is paying off. It has a lower operating price per passenger per mile. There are some interesting remarks to be made about BART. It took time before BART was able to fulfill its long-predicted usefulness. Success of BART was and is dependent on the supply of passengers by other forms of public transportation (bus lines, streetcar lines) that had not immediately readjusted themselves. Passengers arriving by car — who need parking spaces outside a BART station — may add the extra passengers to make BART financially better off. Yet from the perspective of economies of scale the parking spaces in themselves are not sufficient enough for a well functioning RRT. The move from low density (one person per car) into a large density vehicle (like BART) is too large of a step and does not provide the best environment for successful scale of economies. Intermediate steps, connections by bus and streetcar lines, need to be (put) in place for an RRT to function well. It is not a surprise that it took time for BART to become a fully accepted member of an infrastructure of — what had been up to then — an old-fashioned transportation network. On top of that BART was implemented while replacing — and thus not augmented by — large sections of the older public transportation network. One can almost see that the planners eyed the model of Paris; they made the political choice to have BART be an almost independent system onto itself. However, industries functioning in an environment where scales of economies are important are never truly independent. Caution is therefore in place for BART when it tries to expand with expensive rails into low density suburbia (and beyond). This is something no self-respecting self-funded organization would ever do; expansion is only done when the conditions are close to perfect — and they are not for BART that still receives a subsidy of 40%. Los Angeles's MTA made a similar mistake by moving out East of the Southland too quickly when it had not established a significant metro network in Los Angeles yet. Today, no good synergy effect for subway connectivity has been established in Los Angeles, making any expensive outreach to suburbia a faulty decision that will haunt this transit organization for a long time. No matter what the political wind is of the moment, areas with low density should not get the immediate benefits of big city living. It is not wise to deliver state-of-the-art rail to the most wasteful land use patterns 'in' town. RRT belongs to the heart of agglomerations and should only sparingly go to the edges. A last remark about BART is that it, too, uses single segments of tracks for multiple lines (like in San Francisco under Market Street); apparently to avoid transfers. This means that BART could improve on its service on these sections when it reaches full capacity of its current setup. The fact of ten cars per train moving along the line creates a higher capacity point than for instance Muni's one, two, or sometimes three cars per train. BART may therefore push the decision further back to the future to change their operation set-up because of this higher capacity. Nevertheless, it is funny to realize that BART was setup with the same choice as Muni to use its metro infrastructure as a train system: a choice not often seen in the world.
The Regional Transportation Plan (RTP) is a comprehensive plan for transportation development in the nine Bay Area counties. This plan is set up by the Metropolitan Transportation Commission (MTC), which was created by the state legislature in 1970. Unlike the MTA (Metropolitan Transportation Authority serving Los Angeles county) the MTC functions as both the regional transportation planning agency and — for federal purposes — as the region's metropolitan planning organization (MPO). As such, it is responsible for the Regional Transportation Plan, a comprehensive blueprint for the development of mass transit, highway, airport, seaport, railroad, bicycle and pedestrian facilities. There are eight primary public transit systems as well as numerous other local transit operators, which together carry an average weekday ridership of about 1.5 million. The combined annual operating budget of the transit agencies is over $1 billion, placing this region among the top transit operating budgets in the nation. While much needed investments in public transportation are under way, not much was mentioned specifically in the RTP for looking at improving local transportation organizations like Muni. Nice words on system management did not mention anything in specific on helping public transportation agencies improve the efficiency of their operations, yet ample attention was given to improve the efficiency of the freeway system — "with 74 trucks that continuously control the most congested freeways, the Freeway Service Patrol's primary purpose is to cut down on traffic jams by quickly clearing accidents and other incidents... "The RTP mentions control measures, but talks about seeking sources of new revenue for expanding public transportation projects — it does not mention using the money we already have better.
There are two important attributes of why scale of economies works so well for public transportation: each bus has a single driver driving it, each metro has a single driver driving it. One carries a bus load of people, the other many times that bus load. Also: when each mode can work according to its own possibilities, nobody has to wait for the lowest denominator anymore. The simple fact that there are different ways to get to the same results in different cities show that it is very important to look at what system works best under what kind of circumstances. If a system has continuously recurring waste compared to other cities, it may be better to apply the money to more expensive investments that pay back their money in time by creating long-lasting substantial savings. But it needs to be done wisely: expensive investments should only go to projects where money can really be saved in operating costs. The worst form of waste, of course, is money that does not need to be spend at all because the current infrastructure isn't used wisely. So when success came to Muni Metro and the used system quickly undermined its own success there were choices available to fix the problem: either the setup of operations could have been changed or money could be spent on ATC so we can keep on doing what we were already doing.
Serious service problems arrived in the summer of 1998 as MUNI attempted a rollout of a proof-of-payment fare system, a new ATC signaling and control system, a new extension of MuniMetro to the Caltrain Terminal, and integration of the new but incompatible Breda with the old LRV (Light Rail Vehicle) cars all simultaneously. We can argue whether the Automated Train Control system installed to help metros turn around at the end of the tunnel was really necessary. It was a fact, however, that the situation was not perfect. Unlike Boston and Philadelphia's transit, Muni had a so called stub-end terminal at the end of its tunnel. ATC is a system that Muni installed in order to increase the frequency of trains in the metro tunnels. It was built as part of the Embarcadero Turnback that added a new section to where the tunnel used to end. Yet Rescue Muni's Richard Mlynarik did put some painful truths in Muni's choices when he said: "Most fundamental is the question of why Muni was installing a multi-million dollar, newish-technology, moving-block signaling system in a small-scale, medium-traffic, medium-headway railway system in the first place." Installation of ATC was budgeted to be below $30 million, it was then contracted to Alcatel at around $50 million, and has ballooned to represent an expense of nearly $80 million (including nearly $30 million in 'facilitation' fees paid to the Booz-Hamilton consultancy).
There exists a Siamese twin in Muni operations. The streetcar system above ground and the subway tunnel from West-Portal to the Embarcadero appear to be fully conjoined. The operation to separate both and have them function independently must be done very carefully with slowly allowing each part to function all by itself. It may take up to three years before all participants will be convinced that it was wise to go ahead with the operation. However, the smile function (both for Muni employees and Muni passengers) should be fully restored and functioning well — and better — within a period of six months.
Muni's figures for 2000 can be used to showcase that there was a success after all to the implementation of the ATC system, while a larger trend can be found that shows that people really like public transportation by rail better than the bus. Taking the horrible year 1998/1999 as the low ball, and the particularly good year of 2000/2001 as the high, a 40% jump is found in Muni Metro LRV ridership. The overall increase for Muni is in this period only 8.5%. Clearly, there is a preference for rail and ATC helps bring back confidence people have in the system. Over the long haul (1992/93 - 2001/02) the trend is less dramatic, but still great: a 21% jump in ridership on J, K, L, M, and N. And here can we see the real preference: the motor coach (diesel bus) has a decline for that period of 0.56%, the trolley coach (electric bus) has a decline of 3.71%. Given the chance, people jump on the vehicle with rails. This phenomenon of preferential use of rail was seen in Toronto and in Rotterdam as well where in the latter city 46% of the passengers used the metro, and 32% used the streetcars. Muni Metro is only able to transport 21% of its passengers by LRV, while the line follows the most strategical trajectory one could think of in a square city. When placed next to the fact that Muni Metro has the highest load factor in the industry nationwide it is obvious that Muni's riders would like a better solution on rail right now. The load factor is a measure of crowding on board a transit vehicle. When the Muni Metro is available, people love it, but crowding on board means the potential is actually much bigger than the capacity.
As a last note I hope I have been clear that the market forces do not need to take control of public transit. I think that a framework of comparison — where operation results lead to a thumbs up or down — for achieving financial support from governmental subsidizers may be all that is needed; something like using a framework such as established through the Canadian report. The bad apples will then get scrutinized and bad choices will be reversed. Looking at choices that others have made is helpful in achieving a better product yourself; it is a safe way of finding out what is best for yourself. The public transit agencies may get energized by being placed in such a 'soft-competitive' framework. We all know that a blank check never helped streamline an organization no matter the good intentions and the nice words. When there is no comparison to what is 'good' and what is not, what action can then ever be considered 'best?' In the mean time, passengers keep losing fifteen, twenty minutes or more every day — it makes those who have a choice take the car — it undermines the city-product, it makes the city be less than what it could be. Pollution would diminish when more people stopped driving their car when transit delivers a better product, and pollution is also cut when the transit vehicles are used in a more optimal fashion. I am not a big proponent of shipping off public transit to the private sector. But if everything else fails — if a transit organization like Muni in a city like San Francisco keeps delivering a bill that is truly much bigger than 60% of its cost year after year — then I like to keep that option open. Top